If you’ve ever Googled “what’s a good Shopify conversion rate,” you’ve probably been told the answer is around 2–3%.
That number is mostly useless.
Here’s why: that average includes brand-new stores that haven’t sold a thing, stores with broken checkouts, stores getting irrelevant traffic from bad ads, and stores that were set up as experiments and never touched again.
The number you actually need is what a well-run store in your specific niche should be converting at.
That’s what this post is about. We’ve pulled together 2026 benchmark data from multiple studies — Littledata’s analysis of 2,800 Shopify stores, Shopify’s own internal benchmarks, and IRP Commerce’s industry-wide data — and broken it down by niche so you can actually compare apples to apples.
Why Conversion Rate Varies So Much by Niche
Before we get to the numbers, it’s worth understanding why conversion rates are so different across product categories.
Price and purchase risk are the biggest factors. When someone spends $14 on a face wash, the stakes are low. If it’s bad, they’re out $14. They’re more likely to impulse-buy and less likely to spend time researching. When someone spends $1,400 on a piece of furniture, they need to think about it, measure their room, ask their partner, compare other options. More research = more sessions = lower conversion rate.
Purchase frequency matters too. If someone buys protein powder every month, they know what they want and checkout is quick. If they’re buying a camera lens for the first time, they’ll visit five stores, watch three YouTube reviews, and come back over multiple sessions.
Product tangibility plays a role. Clothes, jewelry, and furniture are hard to buy online because you can’t try them. That hesitation shows up in conversion rates.
Keep this in mind as you look at the benchmarks below — you’re not trying to hit the beauty industry’s numbers if you sell furniture.
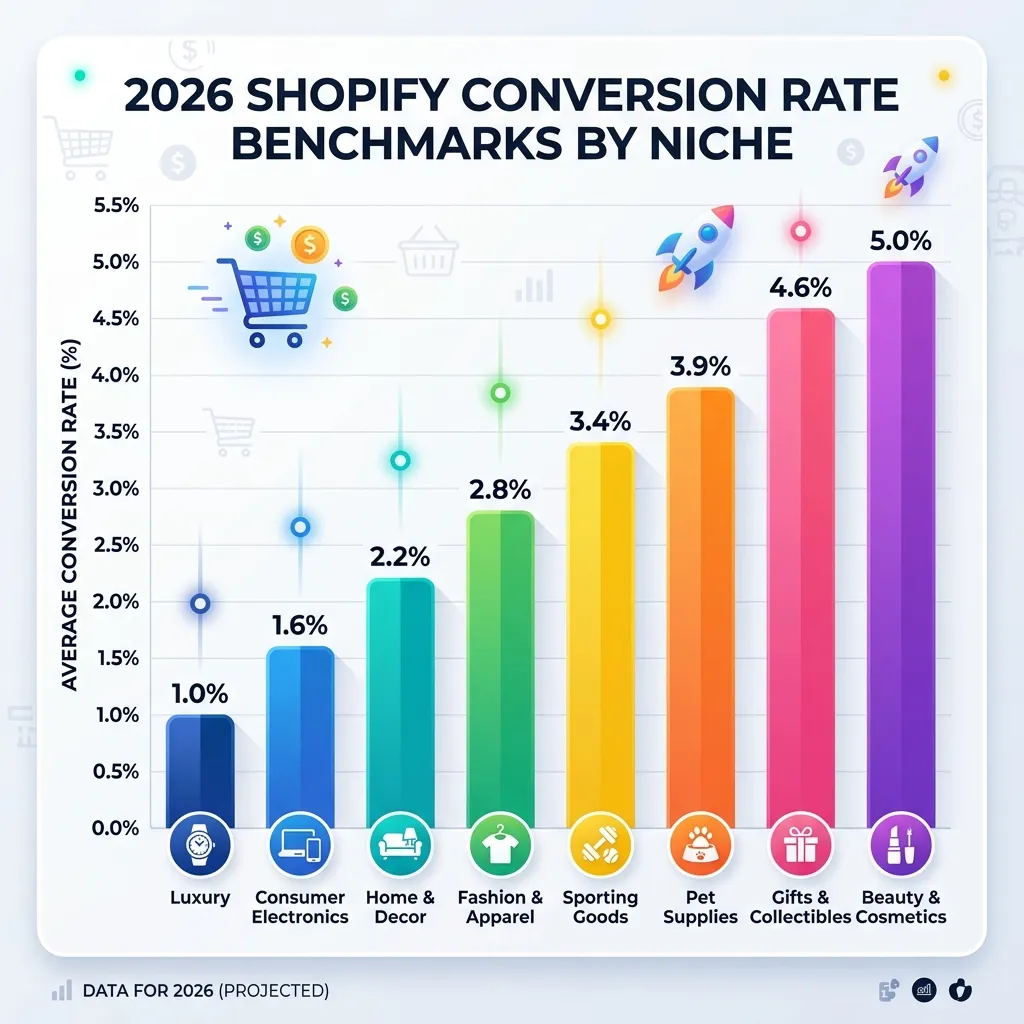
The 2026 Benchmarks by Niche
Here’s where your store should be — based on aggregated data from multiple studies across 2025–2026.
Gifts & Specialty: 4.5–5.0%
This category consistently converts the highest because the buying decision is usually simple (it’s a gift, someone else will use it) and the items are low-risk purchases. Emotional motivation is high — people want to give something nice. If you’re in this space and converting below 3%, something is broken in your funnel.
Beauty & Personal Care: 4.5–4.9%
Beauty is a repeat-purchase category with high brand loyalty. Once someone finds a moisturizer or serum they like, they come back every 6–8 weeks. Social proof (reviews, photos, influencer mentions) is extremely effective here — people trust other people’s skin results more than product descriptions.
Food & Beverage: 3.0–4.5%
Wide range because it includes both impulse purchases (artisan snacks, craft hot sauce) and considered ones (specialty coffee equipment). The low-friction, consumable products in this space convert very high. If you’re below 2% here, your product descriptions and photos are probably underperforming.
Health & Wellness: 3.0–3.5%
Supplements, fitness gear, and wellness products benefit from strong social proof and benefit-focused copy. The “Does this actually work?” hesitation is real — stores that address it with testimonials and reviews tend to outperform those that lead with ingredients and specs.
Fashion & Apparel: 2.5–3.1%
Size uncertainty, fit concerns, and high return rates all create friction. Stores at the top of this range typically offer detailed size guides, multiple product photos (including on-model shots), and clear, easy return policies front and center on the product page.
Home & Garden: 2.1–2.8%
Home products often involve a longer consideration period — people measure spaces, check compatibility, consult partners. Good product photography showing scale, “in-room” lifestyle shots, and strong reviews move the needle here more than urgency tactics.
Electronics & Tech: 1.4–2.3%
High research period, high price points, and strong competition from Amazon and big-box retailers pull conversion rates down. Spec accuracy, compatibility details, and trust signals (warranty info, return policy) matter more here than anywhere else.
Jewelry: 1.2–2.0%
Jewelry is personal, often expensive, and hard to assess from photos alone. Stores that offer video of pieces being worn, detailed material descriptions, and easy return/exchange policies consistently convert better than those relying on still images alone.
Luxury & Premium (1.0–1.5%)
Low conversion by design — the customer journey for a $1,500 handbag or a $3,000 watch involves many touchpoints. Don’t benchmark yourself against mass-market stores. A 1.2% conversion rate with a $900 AOV is a more profitable business than a 4% conversion rate with a $22 AOV.
How to Calculate Your Own Conversion Rate
Before you benchmark yourself, make sure you’re measuring the right thing.
Shopify’s default conversion rate calculation is:
Conversion Rate = Total Orders ÷ Total Sessions × 100
You can find this in: Shopify Admin → Analytics → Reports → Behavior → Online store conversion rate.
A few things to check:
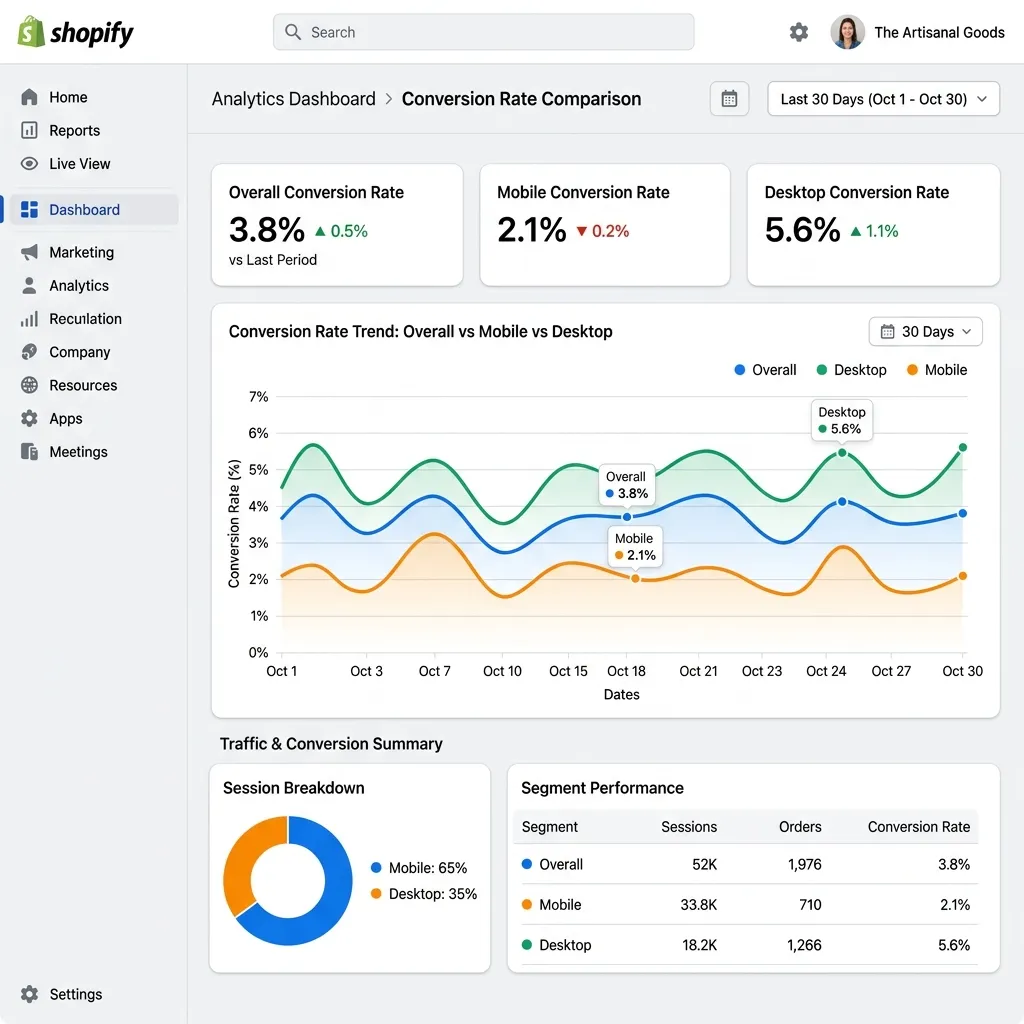
Don’t look at blended numbers only. Your overall conversion rate hides what’s really happening. Break it down by:
- Mobile vs. desktop (usually a 1–2% gap between them)
- Traffic source (organic search converts much higher than paid social)
- New vs. returning visitors (returning visitors should convert at 2–3x the rate of new ones)
If your mobile rate is far below your desktop rate, your mobile experience has friction issues. If your paid traffic converts far below organic, your ads are bringing in the wrong audience.
The Most Common Reasons Stores Convert Below Their Benchmark
Once you know where you stand compared to your niche, the next question is: why are you under-performing?
Here are the five most common culprits, in rough order of how often they show up:
1. Slow page load speed (especially on mobile)
This is the silent conversion killer. Google’s data is clear: as mobile page load time goes from 1 second to 3 seconds, the bounce rate goes up by 32%. By 5 seconds, it’s up by 90%. Every app you’ve installed on your Shopify store adds JavaScript to your page. Audit your apps — remove anything you’re not actively using, and make sure any apps you do use load asynchronously rather than blocking your page render.
2. No social proof on product pages
If your product pages have zero reviews and no recent purchase activity, you’re asking strangers to trust you with their money without any evidence. This is the single biggest driver of “checkout anxiety” — that nagging feeling that maybe this store isn’t legit, or maybe the product isn’t good enough to have earned reviews yet. Even 5–10 genuine reviews per product makes a significant difference.
3. Surprise shipping costs at checkout
Showing a $7.99 shipping fee for the first time at the checkout stage is one of the top reasons for cart abandonment worldwide. The solution is simple: show shipping costs early (on the product page or in a persistent banner), or set up a free shipping threshold that incentivizes customers to meet a minimum cart value.
4. The buy button disappears on mobile
On most Shopify themes, the Add-to-Cart button is at the top of the product page. Once a mobile user scrolls down to read reviews, they’ve lost the button. Adding a sticky Add-to-Cart bar that stays visible as they scroll closes this gap significantly — typically a 10–15% lift in mobile conversion on its own.
5. Bad traffic quality
Sometimes the problem isn’t your store — it’s who you’re sending to it. If you’re running ads to a broad audience or ranking for keywords that don’t match your product, you’ll get traffic that was never going to buy. A 0.3% conversion rate on paid social traffic is normal. A 0.3% conversion rate on organic search traffic suggests something is seriously wrong with your product pages or trust signals.
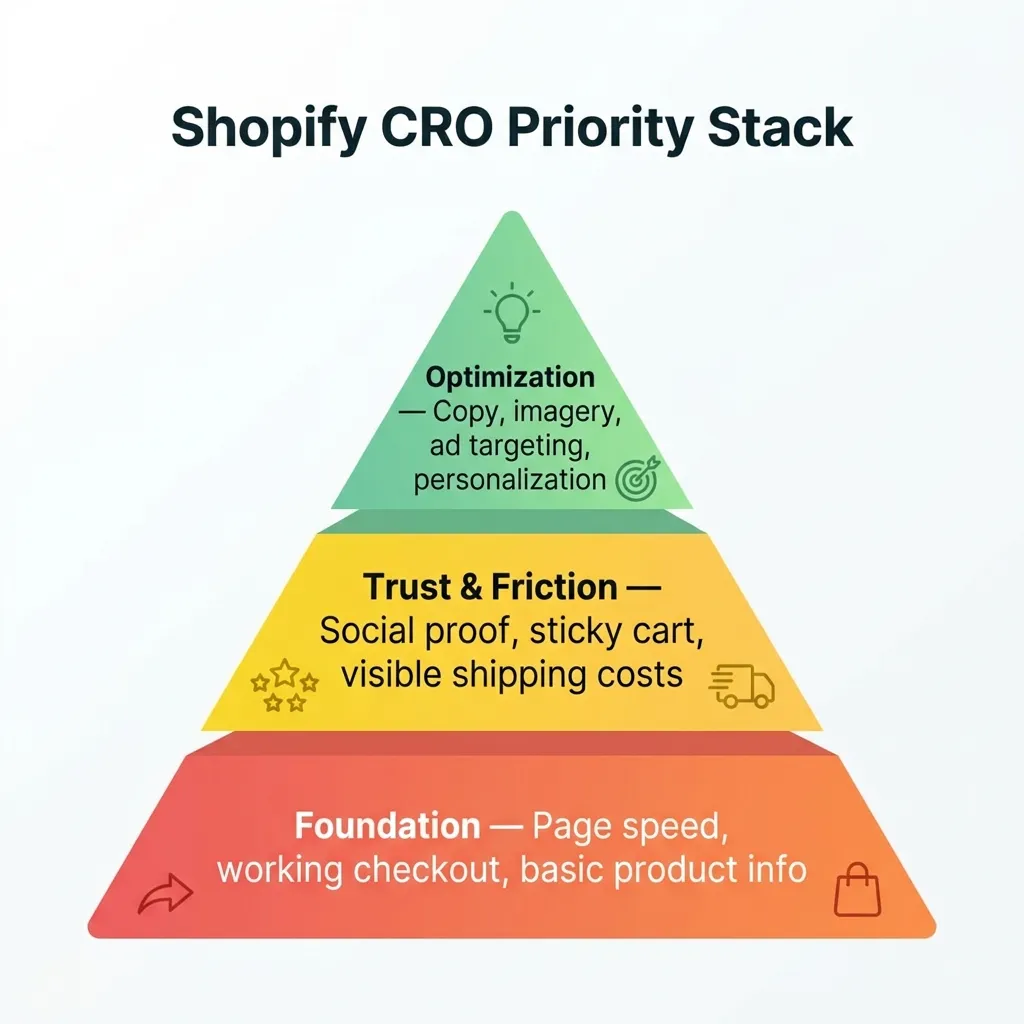
A Simple Priority Plan
Based on where your conversion rate sits compared to your niche benchmark, here’s what to tackle first:
If you’re 50%+ below your benchmark: Start with the basics. Check page speed, make sure checkout works on mobile, and add at least 5–10 reviews to your top 5 products. These are table-stakes issues.
If you’re 20–50% below your benchmark: Focus on trust signals and friction reduction. Add social proof (sales notifications, review counts), fix your mobile experience (sticky cart), and make shipping costs visible before checkout.
If you’re at or near your benchmark: You’re doing the fundamentals right. To break into the top 20% of your niche, look at your product page copy, the quality of your images, and your post-click experience from ads. Marginal gains compound.
Tools That Move These Specific Numbers
For social proof and trust: FomoGen — adds sales notifications, stock alerts, and trust badges. Free plan available.
For mobile friction: FomoGen’s sticky add-to-cart bar keeps the buy button visible on every scroll. See the full guide in our Mobile Sticky Cart post.
For free shipping: FomoGen’s shipping bar shows customers exactly how close they are to free shipping, increasing AOV at the same time as conversion rate.
For page speed: Shopify’s PageSpeed Insights integration in your theme editor — start by removing unused apps, then check your image sizes.
The biggest mistake merchants make is trying to fix everything at once. Pick the one lever that’s furthest below benchmark for your niche and work on just that for 30 days before moving to the next.
Benchmark your store, then fix the right thing. FomoGen handles the social proof and friction layers — free to start, one install, no speed penalty.
Related: Understand why your visitors aren’t buying even after you’ve fixed the basics — read our post on why Shopify visitors leave without buying and what to do about it.